Expert tips
Svalbard
Weather
How to Forecast Svalbard Weather and Sea Ice
Weather and sea ice conditions in Svalbard can change dramatically from week to week, and even within hours. Reliable routines for monitoring weather, wind, waves, and sea ice are essential for planning safe and successful photo expeditions in Svalbard.
Since 2006, we have built extensive experience through more than 150 photography expeditions around Svalbard by ship. Our top priority is always safety, which means avoiding severe weather conditions and minimising the risk of becoming trapped in sea ice. We also aim to reach our target photography areas as efficiently as possible to maximise opportunities to photograph polar bears, seals, whales, birds, other wildlife, as well as Arctic landscapes. We carefully plan our routes to ensure a safe and comfortable experience for our 12 guests on board.
Below, we have summarised the weather, wave, and sea ice forecasting services we use daily when planning our Svalbard expeditions. These tools help us understand and forecast Arctic weather conditions and make better operational decisions in the field.
Ole J Liodden | Published: May 5, 2025 | 5 min read
Last Update: Apr 27, 2026
Sea Ice Conditions and Forecasting
Sea ice around Svalbard varies considerably from year to year, so conditions from previous years will not automatically indicate what to expect in coming years. Historical data can provide some useful expectation, but wind direction, waves, and water temperature all have a major influence on sea ice formation. With ongoing climate warming, this is particularly visible in Svalbard.
The maximum extent of sea ice typically occurs in March, before it slowly begins to melt in April and May. By June, the northern parts of Spitsbergen and Hinlopen Strait are usually open, with sea ice remaining in the fjords. In early July, the sea ice connected to the northeastern parts of Svalbard (Nordaustlandet) is also melting or pushed north, with accessibility extending all the way to Storøya. Depending on wind direction and sea temperature, sea ice in late summer and autumn will normally be positioned between 82°N and 83°N, which requires at least 12 hours by expedition ship to reach the pack ice from the Svalbard archipelago.
With global warming, sea ice around Svalbard is forming later than it did 2-3 decades ago. Whilst freezing previously occurred in Hinlopen and eastern parts of Svalbard around mid-October, this has now been delayed to November or December, with some years as late as January.
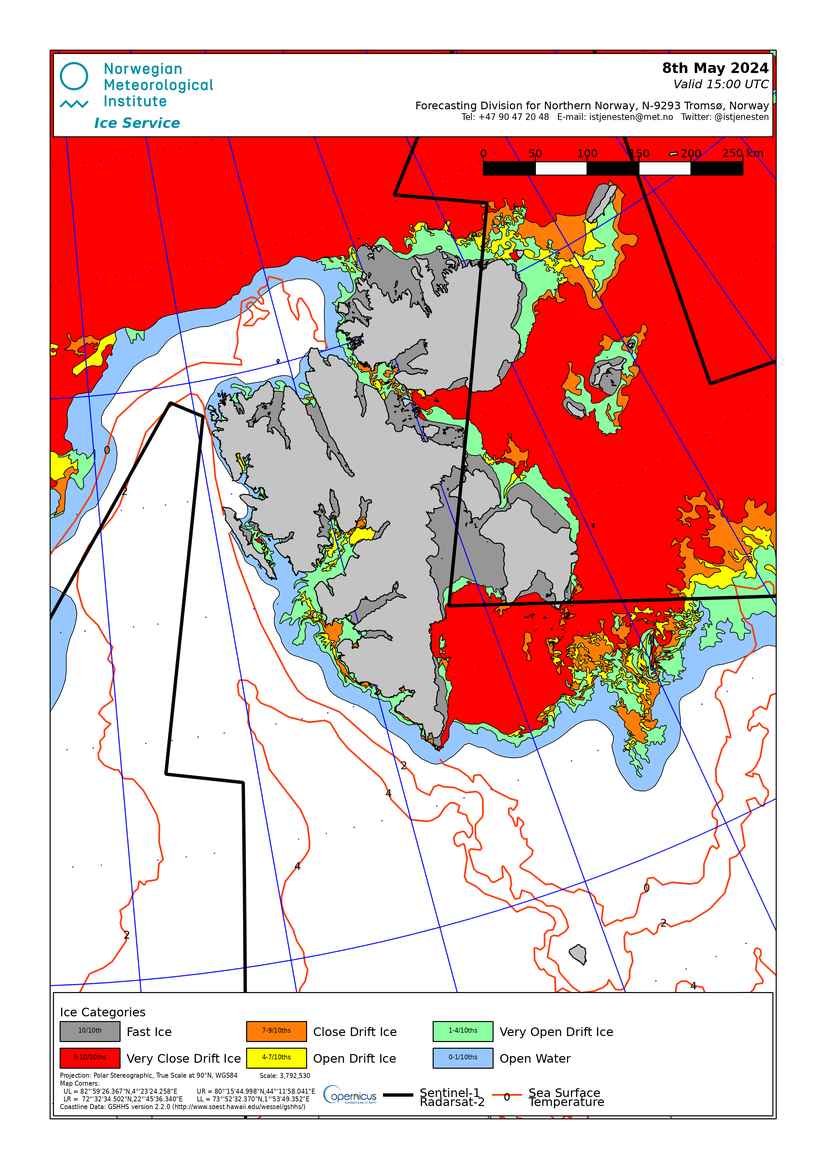
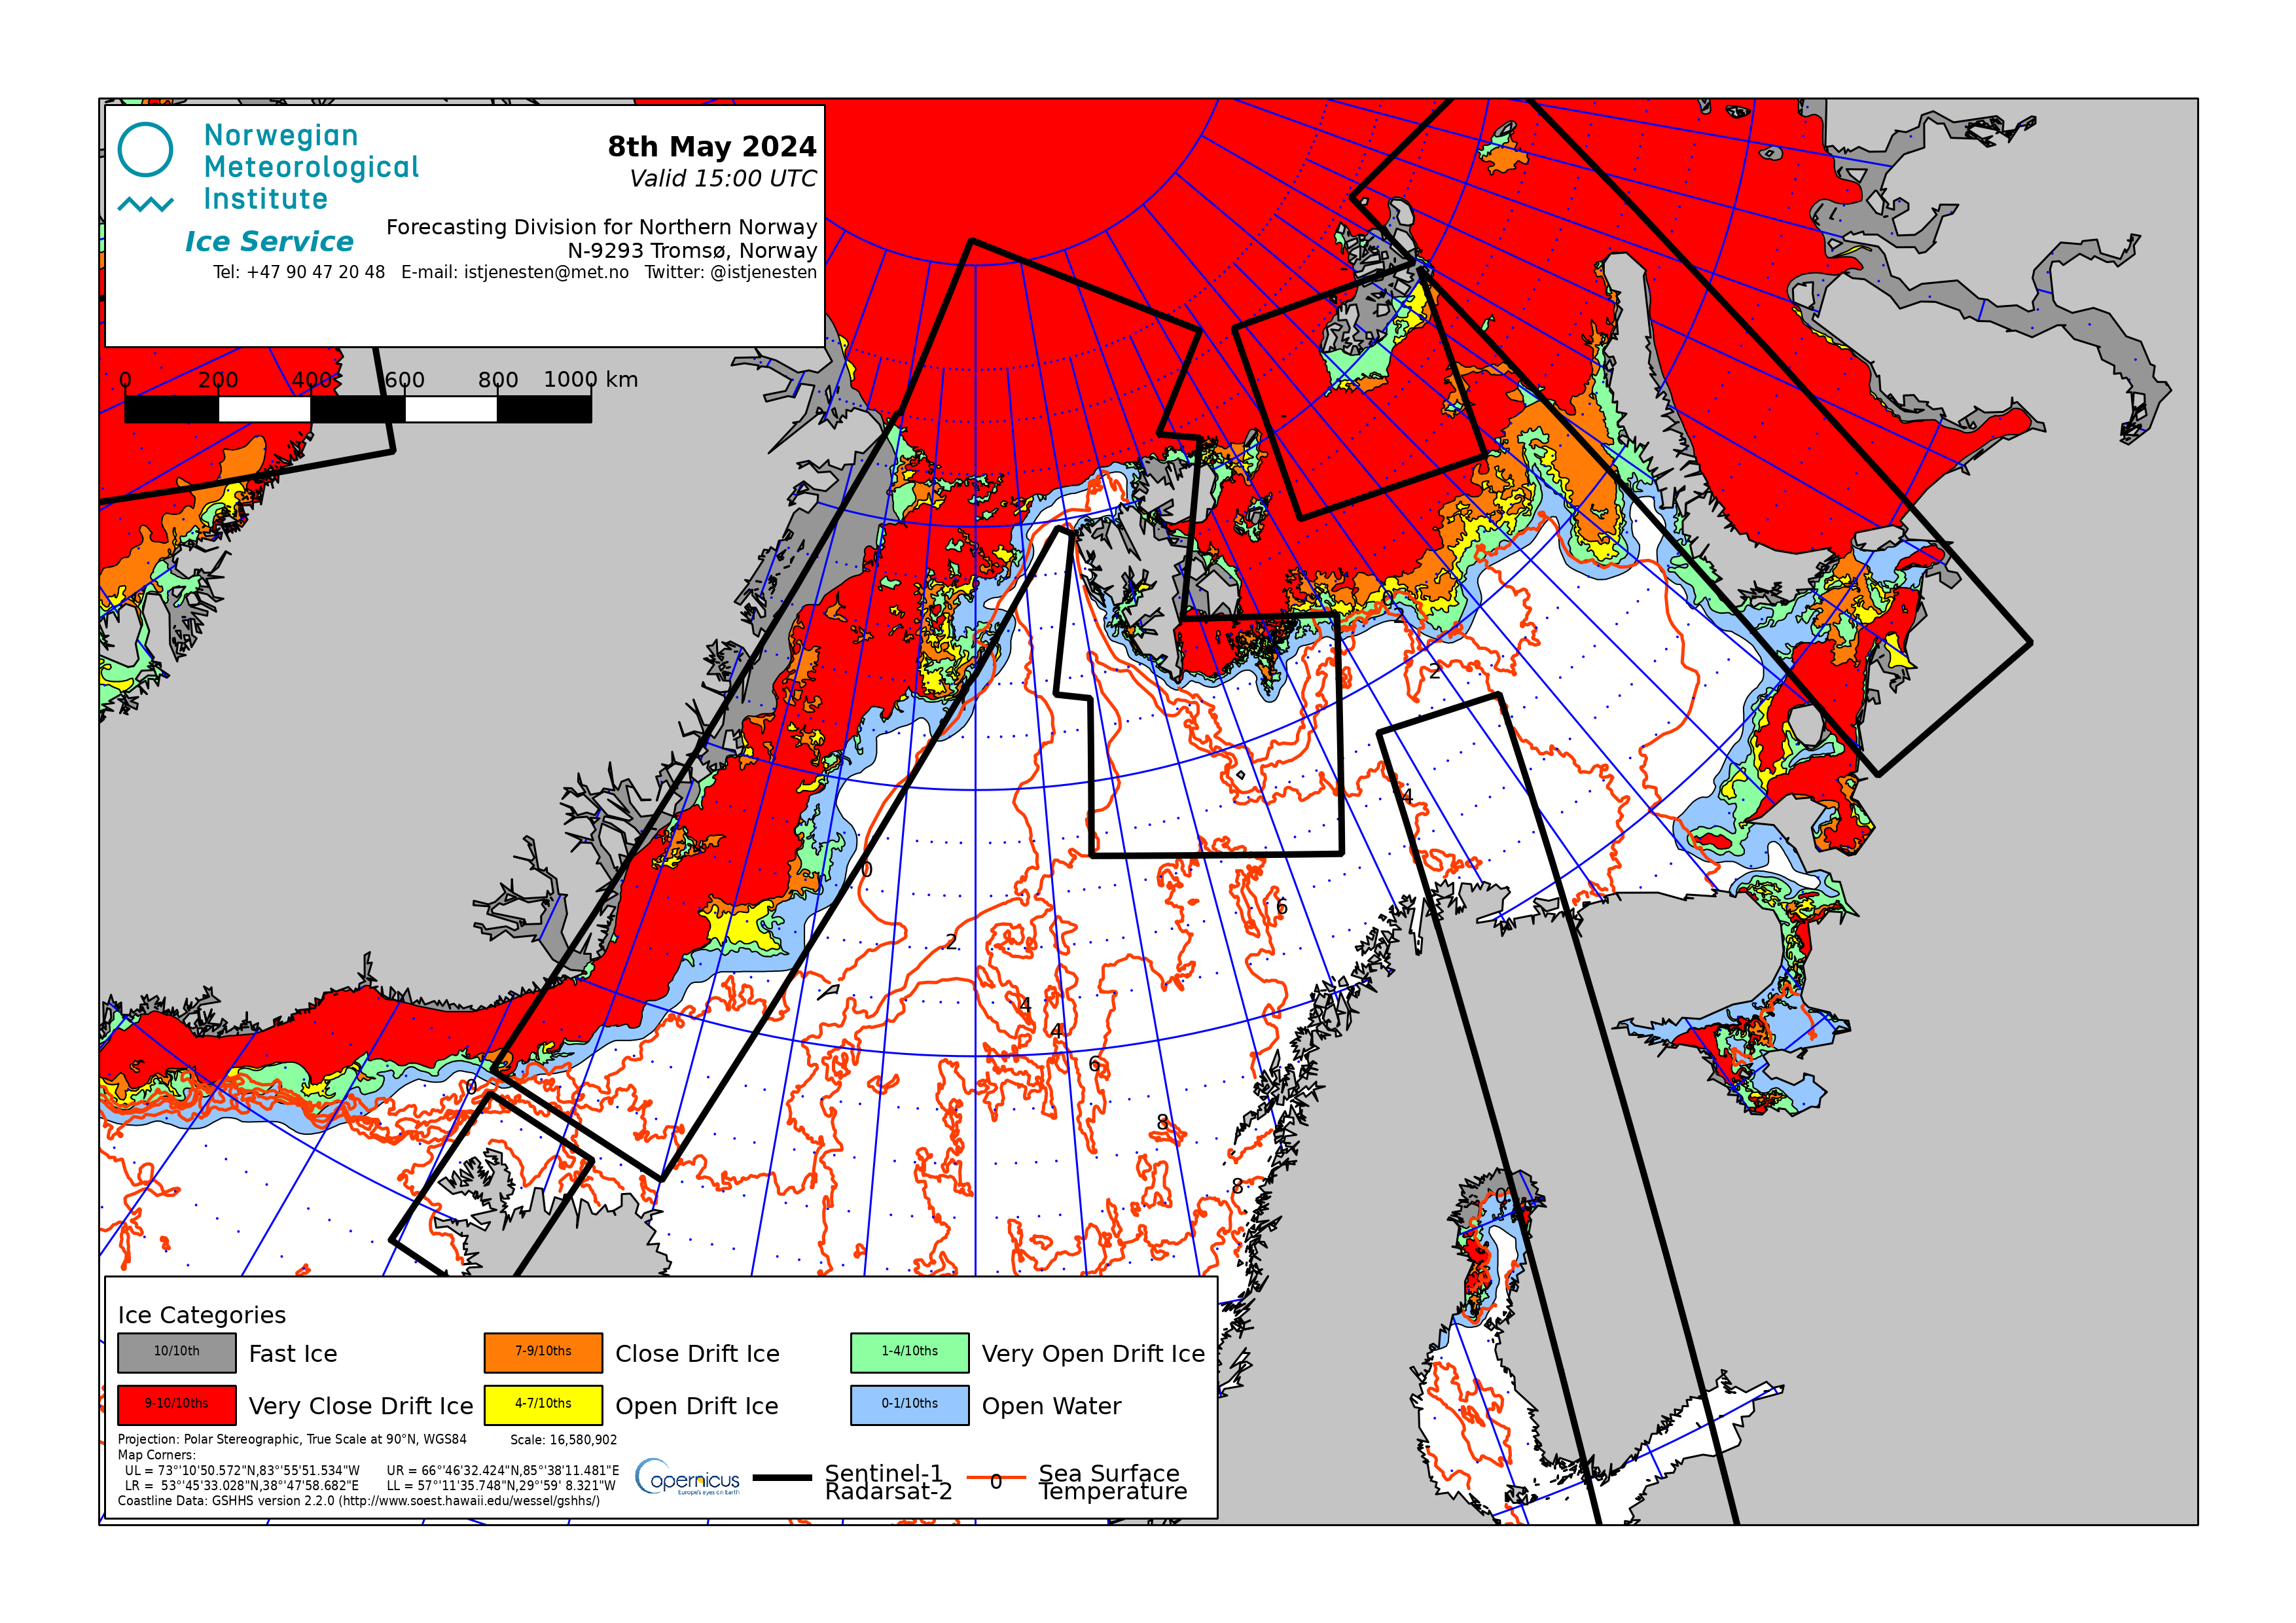
The sea ice maps below for the Svalbard area and Isfjorden/Bellsund are typically updated daily around 16:00 UTC by the Norwegian Ice Service, except at weekends and on public holidays. Blue and white colours represent open, ice-free waters; green indicates areas with very open drifting sea ice. Yellow and orange represent denser sea ice concentrations, where ice-strengthened vessels are necessary for navigation. Red indicates closed drifting sea ice, where ships should not enter, and grey represents non-drifting sea ice, mainly found during winter and spring in the fjords.
Wind Forecast and Weather Systems
Wind forecasting in Svalbard is vital when deciding which areas to visit, and which areas to avoid, in the coming days. For both safety and comfort, itineraries must be adapted to expected and changing weather conditions. Strong winds in the Arctic, combined with waves and freezing temperatures, can be dangerous and must be avoided. Even moderate winds can make zodiac excursions, landings, and life aboard uncomfortable, so adapting itineraries to current and expected wind forecasts is important.
However, calm conditions are not always ideal in the Arctic. During summer with weak southerly winds, the likelihood of fog near the drifting sea ice (pack ice) increases. In many situations, a little more wind, or at least winds not coming from the south, helps reduce fog and improve visibility for photography. Whether the weather forecast predicts sunshine or cloud cover is less important in the Arctic than wind strength and direction.
Typically, strong weather systems pass Svalbard quite quickly and last no more than a couple of days, though winter and autumn may bring more consecutive days of rough weather and wind.
Several services provide reliable wind forecasts, but Windy is the system we have relied upon for many years during our photography expeditions in Svalbard. The Windy app is free to download and provides highly reliable wind forecasts, particularly for the coming 1-2 days. One advantage of this system is the ability to zoom out and observe larger weather systems and their movement direction. You can also easily see wind direction and strength (represented by colours).
We typically plan our photography expeditions in areas with blue (no wind) or green (maximum 10 m/s wind) conditions to ensure comfortable journeys. Sometimes we must navigate areas with winds exceeding 10 m/s, but we then attempt to position the ship so winds (and waves) approach from the front or rear rather than the side. In situations with winds exceeding 15 m/s, it is preferable to find a sheltered fjord or area and wait several hours until conditions calm.
Below is also a service for historical wind data, provided by Cameron Beccario in the earth.nullschool.net project. This system is useful for viewing wind data for specific dates. Simply click on the Earth legend and choose the date in the Control row.
Wave Predictions and Maritime Safety
Wave conditions in Svalbard are closely linked to wind strength, direction, and larger weather systems. Waves hitting the ship from the front (up to 30 degrees deviation either side) are much more manageable than side waves. Front or rear waves of 1–2 metres will not be uncomfortable for most passengers, but when waves exceed 2 metres, smaller ships will experience more pronounced up-and-down movement.
Routes must always be planned for safety and passenger comfort, not only for speed. Windy is an excellent tool also for wave predictions: blue areas show less than 2 metres (within the comfort zone), whilst pink or red areas indicate waves exceeding 2 metres. The earth.nullschool.net project also provides historical wave data for those seeking specific past weather information.
Learn More
Below is a selection of other WildPhoto Expert Tips that you might find interesting.